
Cost to serve analysis calculates the full operational cost of serving a specific customer, SKU, channel, or order so you can make pricing and service decisions based on real economics, not gut feel. It goes beyond gross margin by tracing transport, warehousing, handling, returns, and service costs down to the account or product level. The payoff is direct: you find out which relationships are quietly losing money and which ones deserve more investment.
TL;DR:
- Cost to serve analysis reveals which customer, SKU, or channel relationships generate disproportionate operational costs, guiding targeted pricing and service adjustments.
- Building a credible model requires detailed, transaction-level data from multiple systems, with a focus on matching keys and validating accuracy before applying it to decisions.
- Applying a phased, decision-driven approach improves adoption, allowing pilot projects on specific segments before scaling to broader portfolio redesigns.
- Visual tools like whale curves and customer matrices highlight profitability concentration and service level inefficiencies, enabling more precise commercial negotiations.
- Partnering with a third-party logistics provider can accelerate action on findings by providing live inventory and profitability data without internal infrastructure investment.
Table of Contents
- What Is Cost To Serve Analysis?
- Why Cost To Serve Matters For Pricing And Portfolio Decisions
- What Data Do You Need And Where Does It Break Down?
- How Do You Run A Cost To Serve Analysis Step By Step?
- Reading The Whale Curve And Customer Cost Matrices
- What Mistakes Undermine A Cost To Serve Model?
- Applying Cost To Serve Inside A 3PL Or Fulfillment Operation
- Start Small, Prove It, Then Scale
- When A Fulfillment Partner Helps Turn Cost To Serve Into Action
- Sources
- FAQ
What Is Cost To Serve Analysis?
Cost to serve (CTS) measures the end-to-end operational cost of fulfilling a customer, SKU, channel, or order at a given service level. It’s different from cost of goods sold or gross margin, both of which stop at production and ignore what happens after the sale. Gartner defines cost to serve as an analysis that calculates the profitability of products, customers, and routes to market using allocations tied to complexity and activity, not flat percentages.
A usable CTS model typically includes these cost categories:
- Inbound and outbound transportation
- Warehousing and storage
- Order picking, packing, and handling
- Returns processing
- Customer service and account management
- Working capital tied up in inventory
The scope question matters as much as the cost list. Before you build anything, decide what the “cost object” is: a customer, a SKU, a channel, or an order type. That choice should be driven by the decision you’re trying to make, not by whatever data happens to be easiest to pull. Cost to serve analysis connects operational cost drivers to specific customers, products, or channels so you can see exactly which relationships consume disproportionate resources.
Why Cost To Serve Matters For Pricing And Portfolio Decisions
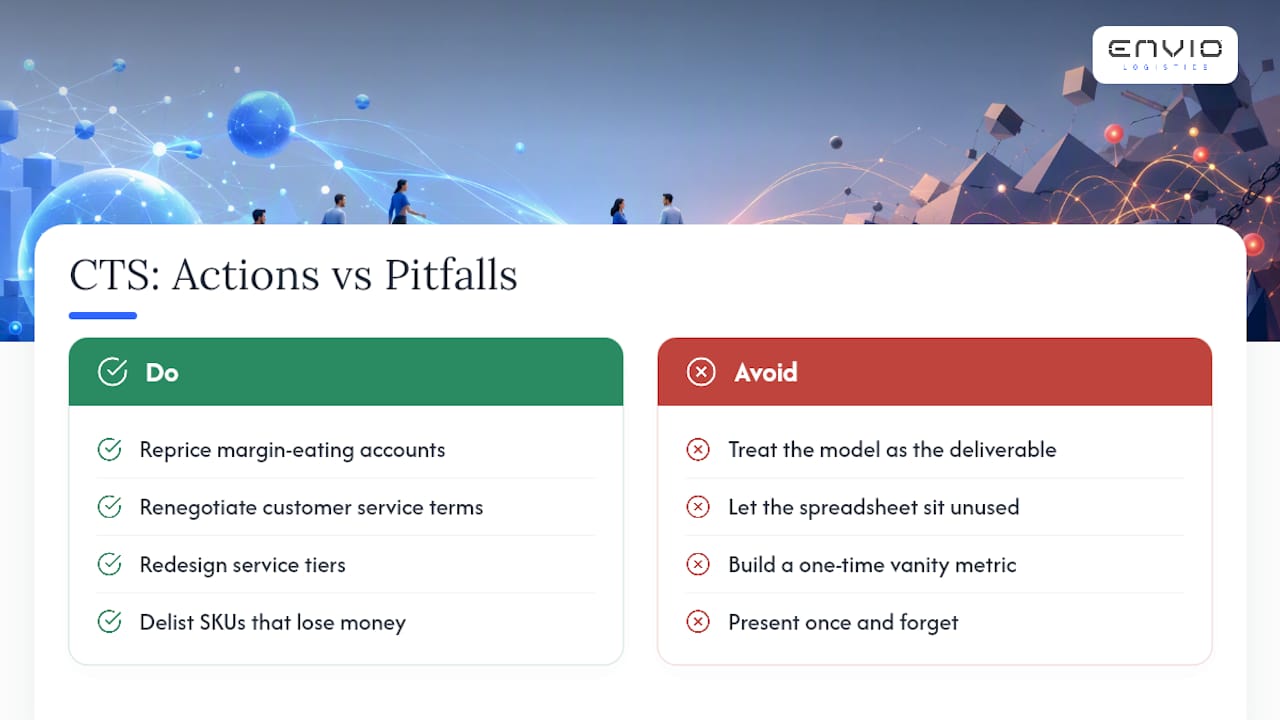
CTS earns its place on a supply chain leader’s desk because it changes real decisions, not because it produces an interesting report; for a deeper dive into linking CTS outputs to pricing and assortment decisions, see this Product Profitability Analysis. When you know the actual cost of serving each customer, you can reprice accounts that are eating margin, renegotiate service terms, redesign service tiers, or delist SKUs that look profitable on paper but bleed cash once handling and returns are factored in.
Consultants who work in this space describe CTS as less about cutting costs and more about repositioning service propositions and negotiating better terms with the customers who actually drive the cost. That reframes the whole exercise. Instead of an internal audit, CTS becomes a commercial conversation: which accounts deserve a volume discount, and which ones need a minimum order size or a surcharge for special handling.
The mistake most teams make is treating the analysis itself as the deliverable. A CTS model that sits in a spreadsheet and never triggers a repricing conversation or a service-tier change has produced nothing. Practitioners increasingly frame CTS as valuable only when it’s tied to a specific decision such as pricing, service-level changes, or network redesign. Otherwise it risks becoming a one-time vanity metric that gets built once, presented once, and forgotten.
What Data Do You Need And Where Does It Break Down?
Building a credible CTS model means pulling from multiple source systems that were never designed to talk to each other. You need transaction-level detail, not summary totals, and you need it tied to consistent keys across systems.
The typical data sources look like this:
- ERP: general ledger cost pools, purchase costs, freight invoices
- WMS: pick lines, pallet moves, storage locations, labor hours
- TMS: miles driven, freight cost per shipment, carrier surcharges
- CRM: service tickets, account touches, escalation frequency
- Sales systems: order volume, terms, discounts, payment timing
At enterprise scale, joining ERP, WMS, TMS, and CRM data with consistent keys is often the hardest part of the whole project, harder than the allocation math itself. Customer IDs that don’t match between the order system and the CRM, or SKU codes that get remapped between the WMS and the ERP, will quietly corrupt your results before you’ve run a single calculation.
Three practical techniques help here. First, sample a subset of orders and manually trace them from order entry through delivery to confirm your data model reflects reality before scaling it. Second, when a cost driver isn’t directly measurable, use a transparent proxy and document exactly how you derived it. Third, run a connection check between your model’s totals and finance’s general ledger before you present anything. If the model can’t be reconciled and audited by finance because keys across ERP, WMS, TMS, and CRM don’t match, the model gets dismissed regardless of how sound the methodology is.
How Do You Run A Cost To Serve Analysis Step By Step?
A decision-first approach beats an attempt to model the entire business at once. A phased, pilot-based approach improves adoption: scope the analysis to one decision, prove the model works, then expand.
- Define the decision and scope. Pick one pilot segment (a product line, a region, or a set of key accounts), one cost object, and a clear time horizon. Don’t start with “understand all our costs.” Start with “should we reprice our top 20 accounts.”
- Build a cost taxonomy and map activities to drivers. Break down the fulfillment journey into receive, pick, pack, ship, and returns, and attach each activity to an observable driver like picks per order, miles per delivery, or touches per ticket. Avoid mapping to revenue; that hides variation instead of revealing it.
- Choose an allocation method. Blunt averages spread cost evenly and erase the differences you’re trying to find. Time-driven activity-based costing (TDABC) assigns cost based on the time each activity actually consumes, and it needs a practical capacity assumption. Most practitioners use 80 to 85% of paid labor time as the usable capacity figure, since assuming 100% hides idle time inside inflated per-minute rates.
- Compute costs and reconcile to source pools. Run the calculation, then trace every allocated dollar back to a real line item in the general ledger. This is the step that gives finance confidence to sign off on the model.
- Validate, stress-test, and produce decision outputs. Build a whale curve, a customer or channel matrix, and a scenario engine that lets you test a freight rate increase or a minimum-order-size change before you commit to it. A practical CTS implementation often requires 20 to 50 activity-based allocations and works best in a living tool rather than a static spreadsheet.
- Turn outputs into action. Assign owners for repricing, service-tier redesign, contract renegotiation, or fulfillment changes, and set KPIs to track whether the change actually moved margin.
Pro Tip: Run your first pilot on the ten accounts you already suspect are unprofitable. You’ll validate the model faster against instincts you can already check, and you’ll have a repricing conversation ready to go the moment the numbers confirm it.
Reading The Whale Curve And Customer Cost Matrices
The whale curve is the single most useful visual output of a CTS project. It ranks customers or SKUs by cumulative profit contribution, and the shape tells you everything about how concentrated your profitability really is. A curve that peaks early and then dips below zero at the tail means a meaningful share of your customer base is actively destroying margin, not just underperforming.
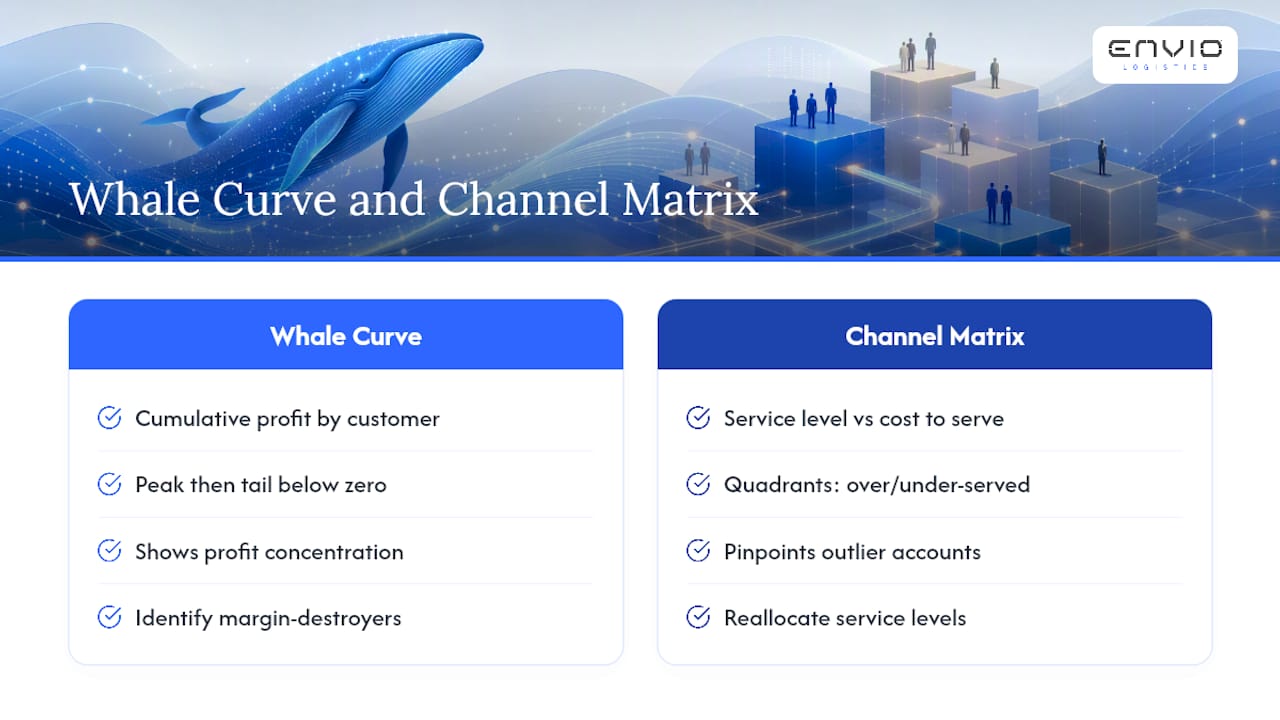
Customer-channel matrices plot service level against cost to serve, and they’re where over-served and under-served segments become visible at a glance. A low-value account getting white-glove service. A high-value account getting minimal attention because nobody flagged it. Heat maps built on the same data make it easy for a commercial team to scan dozens of accounts and spot the outliers without reading a single row of raw numbers.
Scenario outputs turn these visuals into forward-looking tools. Feed in a projected freight rate increase or a new minimum order threshold, and a properly built model recalculates cost to serve across every segment instantly. That’s the difference between a report you read once and a tool you return to every quarter when input costs shift.
What Mistakes Undermine A Cost To Serve Model?
Most CTS failures trace back to a handful of repeatable mistakes, and each one has a known fix.
- Using average allocations. Spreading cost by revenue or headcount erases the variation the analysis is supposed to reveal. Fix it with driver-based allocation, using TDABC where the activity mix is complex enough to justify it.
- Stopping at analysis. A finished model with no assigned decision owner just sits there. Require a named decision, a target date, and an accountable owner before the project even starts.
- Weak data lineage. If nobody can trace a cost from the ledger to the final allocation, finance won’t trust the output. Common failures include relying on historical averages and producing a report that stops at analysis instead of building traceable activity maps validated against the P&L.
- Assuming 100% labor capacity. This hides real cost inside artificially low per-unit rates. Practical capacity assumptions of 80 to 85% keep the model honest.
Pro Tip: Before you present a CTS model to leadership, hand it to someone in finance who had no part in building it and ask them to trace one customer’s total cost back to three separate source systems. If they can’t do it in under ten minutes, your audit trail needs work.
Applying Cost To Serve Inside A 3PL Or Fulfillment Operation
CTS findings hit differently once they reach the warehouse floor. When the analysis shows a SKU requires excessive kitting, custom packaging, or a high returns rate, that’s often a signal the product belongs with a fulfillment partner built for complexity rather than a general-purpose operation stretched to cover it.
The metrics that move cost to serve the most in a fulfillment context are order mix (single-unit versus multi-line), prep requirements for marketplace compliance, returns rate, and any SKU requiring non-standard packaging. Each one adds labor time that a flat per-order fee will never capture accurately.
Transparency in inventory and per-SKU profitability reporting, something a capable 3PL warehousing partner should provide as a baseline, shortens the distance between a CTS finding and an operational fix. When you can see live inventory data and per-SKU margin side by side, a decision to discontinue a product or shift it to a different fulfillment profile takes days instead of quarters.
Start Small, Prove It, Then Scale
Trying to model every cost across every customer at once is how CTS projects stall. A tightly scoped pilot, one segment, one decision, gets you a working model in weeks and gives you something concrete to show finance before you ask for broader buy-in.
Cross-functional sponsorship matters more than the modeling technique you pick. Get finance and commercial in the room early, and build toward a scenario engine you can rerun, not a static report. Then chase quick wins first: reprice your worst loss-making accounts, adjust service tiers for the over-served, and test one SKU delist before you try to fix the whole portfolio at once.
— Claudio Saenz
When A Fulfillment Partner Helps Turn Cost To Serve Into Action
Running the analysis is one project. Rebuilding your fulfillment operation around what it reveals is another, and that’s where most internal teams hit a wall. A fulfillment partner can give small and mid-sized brands the SKU-level profitability reporting and live inventory visibility that a CTS project depends on, without adding another vendor to manage or a long-term contract to negotiate out of.
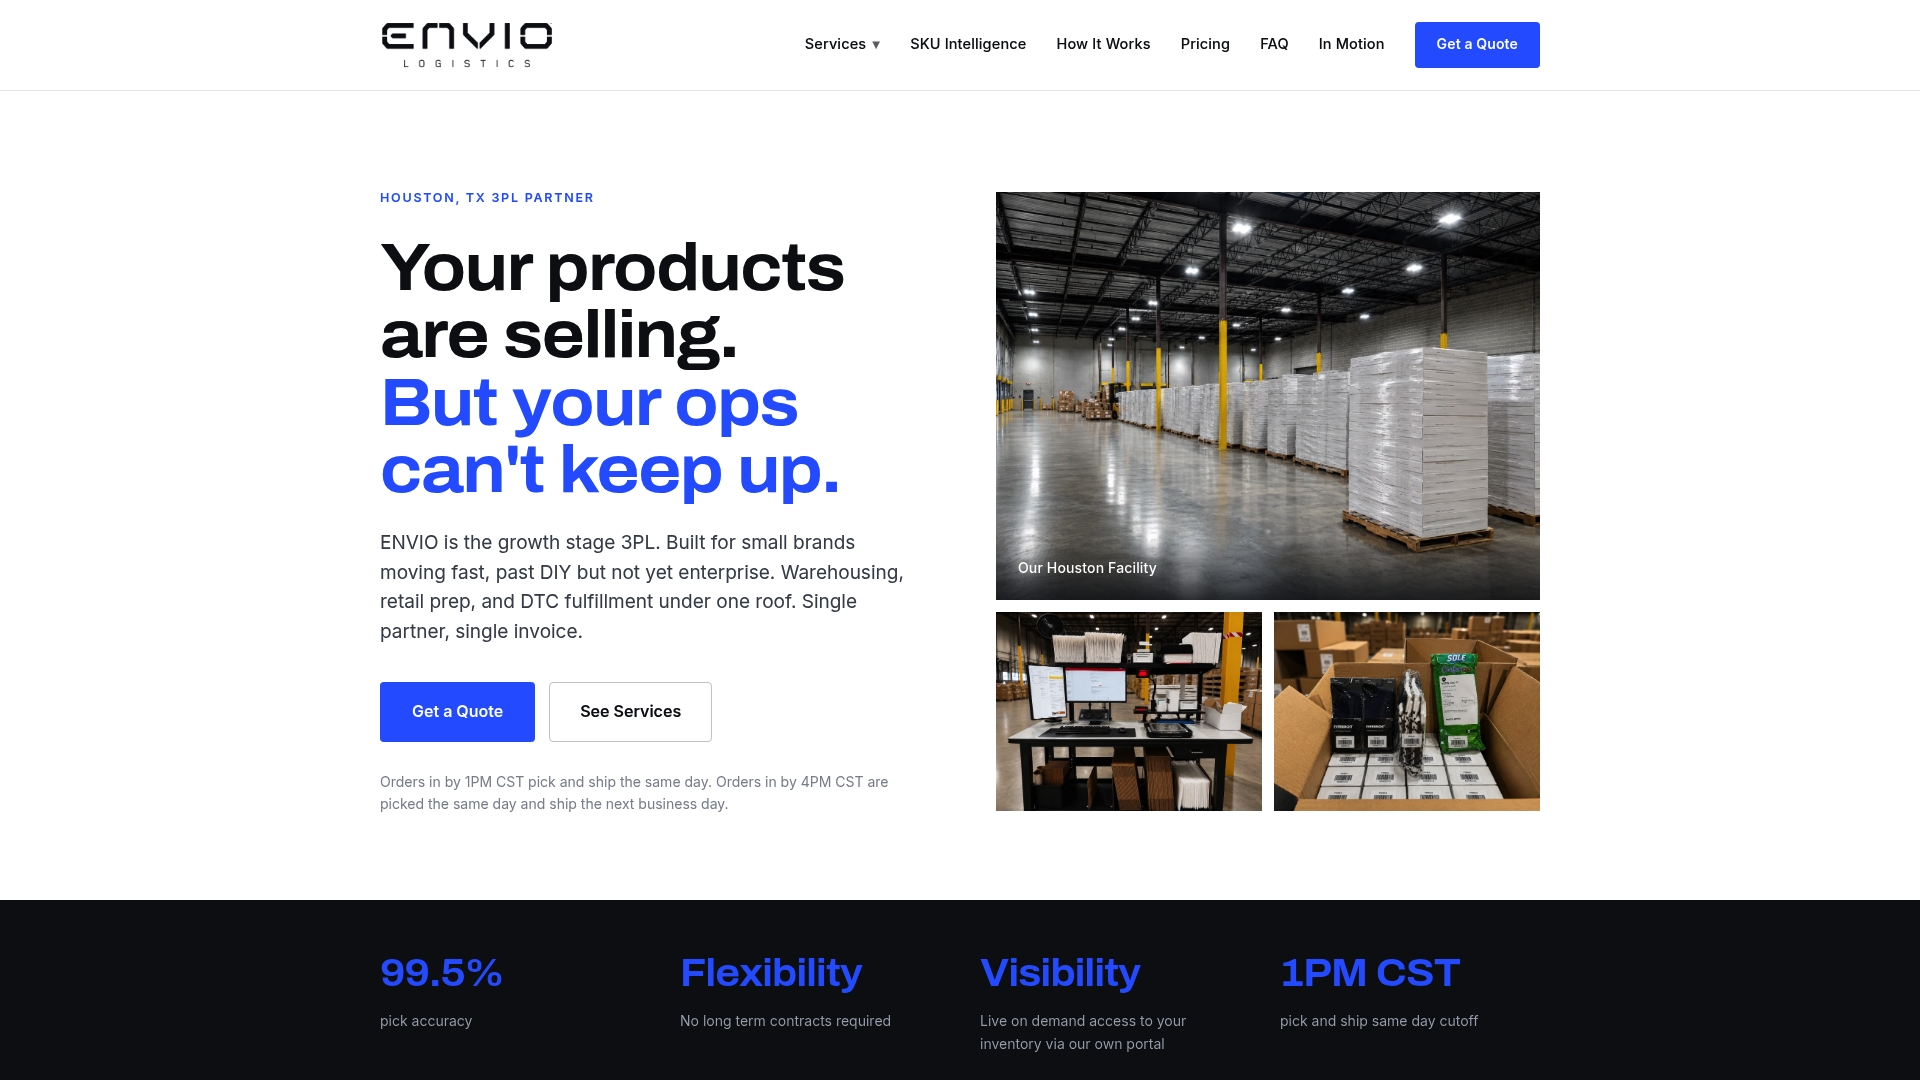
If your analysis just flagged a set of SKUs with heavy prep requirements, high return rates, or marketplace compliance needs eating your margin, that’s exactly the kind of complexity Envio Logistics, Inc’s warehousing and fulfillment services are built to absorb. Same-day shipping on orders placed by 1 PM CST, live inventory data, and no long-term commitment mean you can test a service-tier change or shift a problem SKU to a new fulfillment profile without a multi-quarter vendor negotiation. Building that capability internally makes sense once you have the volume to justify dedicated headcount. Until then, review Envio Logistics, Inc’s services and pricing and request a quote based on your actual SKU mix and order volume.
Sources
- How to Approach Cost To Serve Analysis
- Cost to serve: Improve decision-making, competitiveness and profitability
- Gartner — cost to serve (glossary)
- Supply chain leaders should make cost to serve a priority (KPMG)
- The hidden cost of cost-to-serve (IMD)
FAQ
What Are The Steps Of A Cost To Serve Analysis?
The core sequence is: define the decision and scope, build a cost taxonomy and map activities to drivers, choose an allocation method, compute and reconcile costs to the general ledger, validate with scenario testing, and convert findings into pricing or service decisions.
What Is The Meaning Of Cost To Serve?
Cost to serve is the total operational cost of fulfilling a specific customer, product, or channel at a given service level, covering everything from transportation and warehousing to returns and customer service, not just the cost of goods sold.
What Are The 5 C’s In Pricing?
Definitions of the “5 C’s” vary by source and are not part of a single agreed-upon framework in cost to serve literature specifically; most pricing frameworks referencing this term focus on cost, customer, competition, and similar market factors rather than a fixed CTS standard.
Can A 3PL Help Act On Cost To Serve Findings?
Yes. A fulfillment partner offering SKU-level profitability reporting and live inventory data, like Envio Logistics, Inc, can absorb high-complexity SKUs your analysis flags and help you act on repricing or service-tier decisions faster than building that capability internally.
0 comments