
An inventory aging report sorts every SKU in your warehouse by how long it has sat on the shelf since it was received or last moved, grouped into time buckets like 0 to 30 days or 90-plus days. It matters because aged stock ties up cash, drives up storage costs, and often ends up written off. Read on for a sample report, the exact formulas to build one, and the actions that actually clear out dead stock.
TL;DR:
- Inventory aging reports must include SKU, quantity, unit cost, receipt or last-movement date, and optional data like expiry date or location for accuracy.
- The typical bucket scheme ranges from 0-30 days up to 180-plus days, with more frequent review needed for perishable or lot-tracked stock.
- Correct calculation of days in inventory depends on choosing between receipt date and last movement date, significantly affecting aging accuracy.
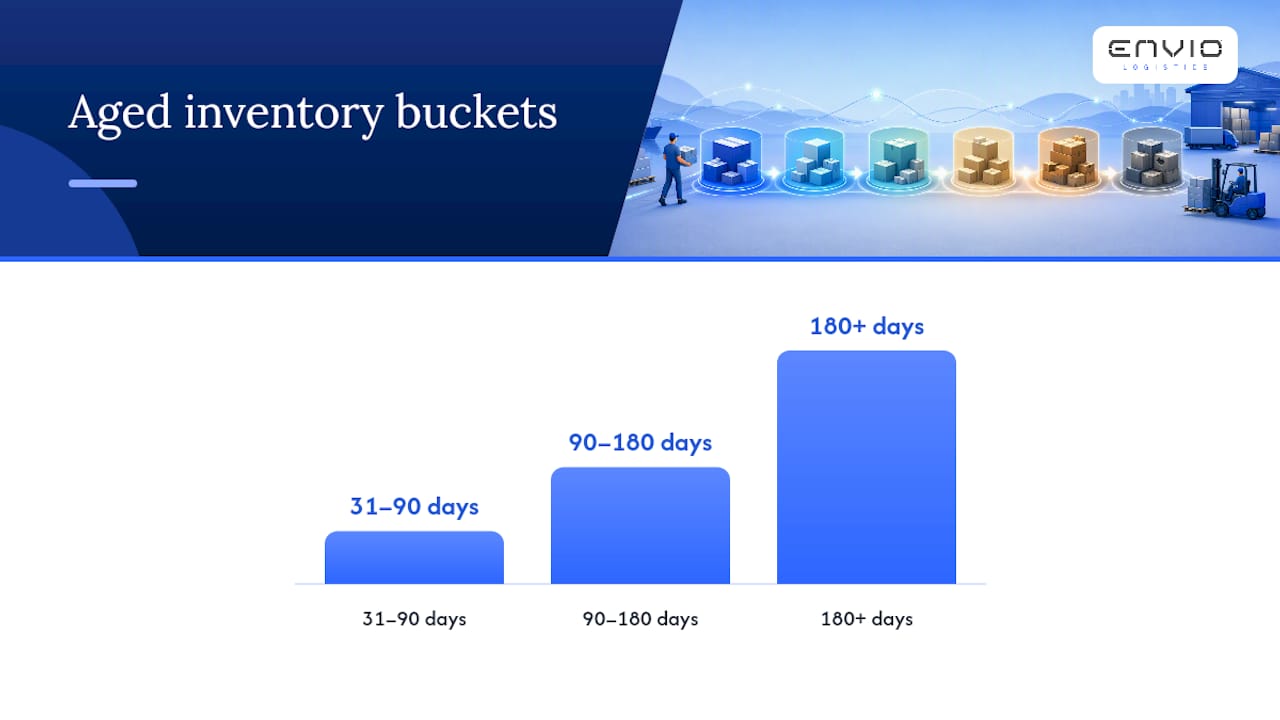
- Action thresholds vary: discounts are suited for 31-90 days, aggressive promotions for 90-180 days, and liquidation for stock over 180 days.
- Automating report generation and integrating real-time inventory visibility through 3PL partnerships shortens reaction time and improves aged stock management.
Table of Contents
- What Does an Inventory Aging Report Look Like?
- What Data Do You Need for Accurate Inventory Aging?
- How Do You Build an Inventory Aging Report in Excel?
- How Do You Read an Aging Report and Prioritize Action?
- What Should You Do About Aged Inventory?
- How Often Should You Run an Inventory Aging Report?
- How Does a 3PL Partner Turn Aging Data Into Action?
- When Should You Prioritize Aging Reports Over Other Metrics?
- How Envio Helps You Act on Aging Insights
- Sources
- FAQ
What Does an Inventory Aging Report Look Like?
A standard aging report lists SKU, description, quantity on hand, unit cost, total value, receipt or last-movement date, and days in inventory, then rolls each row into a bucket. Here’s a simplified worked example for one SKU:
That single row tells you $520 in candles has been sitting for 47 days. Multiply that logic across a few thousand SKUs and you get a full aging schedule with subtotals per bucket, usually split further by warehouse, lot, or sales channel.
Layouts vary depending on the system generating them. Microsoft Dynamics 365’s aging report shows how period-end closing changes the value totals inside each bucket, which trips up a lot of finance teams the first time they see it. A few things drive the differences you’ll see between platforms:
- ERP-generated reports often split by warehouse or site, useful if you run multiple locations.
- Lot-tracked systems add an expiry column alongside days in inventory.
- 3PL or FBA-integrated reports frequently separate “in transit,” “reserved,” and “available” quantities, which changes what counts as aged.
Pick the layout that matches how your business actually loses money on stock. If expiry risk is your problem, lot-level detail matters more than warehouse splits.
What Data Do You Need for Accurate Inventory Aging?
Four fields are non-negotiable: SKU, quantity on hand, unit cost, and a receipt date or last-movement date. Without all four, your aging schedule either miscounts value or miscounts time, and both errors compound at scale.
Beyond the essentials, a few optional fields make the report sharper:
- Lot or expiry date — critical for perishables and anything with a shelf life.
- Warehouse or bin location — needed if stock is split across sites or a 3PL network.
- Committed or allocated quantity — separates stock that’s already sold from stock that’s genuinely idle.
Days in inventory is usually calculated as today’s date minus the receipt date, though some teams use the last-movement date instead, which resets the clock every time a unit is picked, transferred, or adjusted. That choice matters more than most people realize. A receipt-date model flags a SKU as aged even if half of it just sold last week; a last-movement model can mask a batch that’s technically been sitting for months if a handful of units moved recently. For lot-tracked goods, days-until-expiry deserves its own column since a batch can be young by receipt date and still close to spoiling.
Bucket schemes typically run 0 to 30, 31 to 60, 61 to 90, 91 to 180, and 180-plus days, a structure both Finale Inventory and Supply Chain Navigator use as the default. Fashion and electronics often tighten those buckets since a 60-day-old smartphone case is a different problem than a 60-day-old barstool.
Pro Tip: If you sell through Amazon or Walmart, pull your aging data from your own system first, then reconcile against the marketplace’s inventory age report. The two won’t always match, and the gap usually points to a data entry error worth fixing.
How Do You Build an Inventory Aging Report in Excel?
Here’s the exact sequence to build one from a raw inventory export:
- Pull your data. Export SKU, quantity, unit cost, and receipt or last-movement date from your inventory system into a spreadsheet.
-
Calculate days in inventory. In a new column, enter
=TODAY()-[receipt date cell]for every row. -
Assign buckets. Use a nested formula like
=IFS(B2<=30,"0-30",B2<=60,"31-60",B2<=90,"61-90",B2<=180,"91-180",TRUE,"180+"), referencing the days-in-inventory column. - Calculate line value. Multiply quantity on hand by unit cost in a new column.
- Build a pivot table. Set bucket as rows, and sum both quantity and value as your data fields. This gives you the dollar exposure per bucket at a glance.
- Add a percent-of-total column. Divide each bucket’s value by total inventory value to see concentration risk.
For cost basis, most teams use either FIFO or a weighted average, and it needs to stay consistent, since switching methods mid-year distorts every comparison you make afterward. If you carry multiple lots of the same SKU, keep each lot as its own row rather than collapsing them, or you’ll lose the ability to flag the oldest lot specifically.
| Common error | Cause | Fix |
|---|---|---|
| Days in inventory shows negative numbers | Date field imported as text, not a date | Reformat column as Date before calculating |
| Bucket totals don’t match SKU count | Blank or duplicate SKU rows | Filter and deduplicate before pivoting |
| Value looks inflated after period close | Report pulled mid-closing process | Re-run after inventory closing finishes, per Microsoft’s guidance |
Multi-location data needs a warehouse or location column fed into the pivot as a secondary row grouping, otherwise you’ll see aggregate totals that hide a specific site’s dead stock problem.
How Do You Read an Aging Report and Prioritize Action?
The percentage of total inventory value sitting in your oldest bucket is the single number worth watching most closely. Shopify’s benchmark guidance suggests keeping the value older than 90 days under a moderate percentage of total inventory value; cross that line consistently and carrying costs start eating into margin faster than most operators notice.
A few other metrics round out the picture:
- Inventory turnover — cost of goods sold divided by average inventory value, showing how many times stock cycles through in a period.
- Days Inventory Outstanding (DIO) — 365 divided by turnover, translating the ratio into a plain number of days.
- Top aged SKUs by value — not by unit count, since ten units of a $200 item matters more than 500 units of a $2 item.
Benchmarks vary by industry. A furniture brand living with 90 to 120 day cycles is normal; the same window in fresh food is a crisis. Overlay your aging data with an ABC classification, so your highest-value SKUs get reviewed first regardless of which bucket they land in, an approach Supply Chain Navigator recommends for exactly this reason.
Finance teams use aging data to build obsolescence reserves under GAAP’s inventory guidance in ASC 330, applying a reserve percentage to each bucket that increases with age. Expect finance to ask for your aging schedule every month close, and expect the reserve rates to be a negotiated number between operations and accounting, not a fixed formula.
What Should You Do About Aged Inventory?
Different buckets call for different moves, and the biggest mistake operators make is treating every aged SKU the same way. Match the tactic to both the bucket and the item’s classification:
- 31 to 90 days, mid-value: Bundle with a faster-moving SKU or run a modest discount to accelerate the sale before it ages further.
- 90 to 180 days, high-value: Escalate the discount, feature it in email or on-site promotions, and check whether a supplier will accept a return.
- 180-plus days, low-value: Consider liquidation through a wholesale channel or write it off if recovery cost exceeds resale value.
- Any bucket, wrong warehouse: Transfer stock to a location or channel where demand actually exists rather than discounting where it sits.
For B2B or wholesale liquidation, a distributor network like the TCG Wholesale Suppliers directory gives you a channel for moving stock in bulk without torching your retail price on your main storefront.
Operationally, discounting and bundling both require warehouse coordination, not just a pricing change in your storefront. Kitting takes labor and packaging materials, so factor that cost into your margin math before committing. Returns to supplier need a restocking fee negotiated up front, and transfers between locations only make sense if freight cost is lower than the margin you’d lose discounting in place.
Pro Tip: Run your aging report before you plan a promotion, not after. Discounting a SKU that’s about to sell out anyway wastes margin on inventory that wasn’t actually at risk.
How Often Should You Run an Inventory Aging Report?
Cadence depends on how fast your inventory can go bad, financially or literally. Perishables and anything lot-tracked deserve daily near-expiry checks, since a few days can turn a sellable batch into a write-off. Operations teams generally review the full aging schedule weekly to catch slow movers before they cross into a worse bucket. Finance typically only needs it monthly, timed to close.
Automation removes the manual pull entirely. A scheduled query or ETL job can recalculate aging daily, feeding a Power BI or SSRS dashboard that flags top-aged SKUs automatically. Some teams simply email a top-20 aged list to purchasing and merchandising every Monday morning.
Governance matters more than the tooling. Decide which date field is authoritative, receipt or last-movement, lock lot tracking to one system of record, and assign a specific person to own follow-up on flagged SKUs. An automated report nobody acts on is just a prettier spreadsheet.
How Does a 3PL Partner Turn Aging Data Into Action?
Building an aging report is the easy part. Acting on it fast enough to matter is where most small and mid-sized brands fall behind, especially when inventory sits across multiple warehouses or fulfillment centers with no unified view.

A 3PL partner can run a live inventory portal that shows real-time stock levels and age, so a brand’s team can see a bucket shifting before it becomes a quarterly surprise. Pairing that visibility with SKU profitability analysis can turn an aging report from a diagnostic tool into a decision engine, flagging which slow movers are also margin-negative and worth cutting entirely.
A few operational levers matter here:
- Kitting and bundling services can convert aged SKUs into new offers without the brand managing extra labor in some 3PL arrangements.
- Returns processing can clear reverse-logistics backlogs that otherwise sit in an aging report as phantom stock.
- Some 3PLs offer same-day shipping for orders placed by a certain cutoff time, helping move inventory immediately instead of sitting in a fulfillment queue.
For a brand without a warehouse team dedicated to daily aging review, that live visibility often shortens reaction time from weeks to days.
When Should You Prioritize Aging Reports Over Other Metrics?
Aging reports deserve top priority around seasonal transitions, new product launches, and anytime FBA storage penalties loom, moments when a slow-moving SKU turns expensive fast. Outside those windows, some categories can tolerate longer holding periods without real damage. The bigger risk isn’t the report itself. It’s running one on receipt dates that are wrong, lot data that’s incomplete, or last-movement timestamps nobody bothered to update.
— Claudio Saenz
How Envio Helps You Act on Aging Insights
Spotting aged inventory is only half the job. Converting that insight into a sale, a bundle, or a liquidation without adding another vendor to manage is what actually protects your margin. Certain 3PL providers give small and mid-sized brands live inventory data and SKU profitability analysis in one place, so aging signals can turn into decisions more quickly.
Some 3PL providers operate with no long-term contracts and offer timely shipping, allowing bundles or discounts to clear aged stock efficiently. If you’re already running kitting, returns, or Amazon and Walmart prep through a patchwork of vendors, consolidating with a 3PL and warehousing partner tends to cut both cost and confusion. Check out Envio’s services and pricing to see what fits your SKU count and order volume, or start with the Amazon and Walmart prep page if marketplace penalties are your immediate concern.
Sources
For hands-on references, Microsoft’s aging report documentation shows worked bucket calculations, Supply Chain Navigator offers a free template, and Shopify’s guide covers benchmarks and remediation tactics in depth.
- Inventory Aging Report: What It Is, Why It Matters & How to Use It
- Inventory Aging Report (2026): Free Template + Real Examples + Excel Guide | Supply Chain Navigator
- Inventory Aging Report: How To Reduce Aged Stock (2026) | Shopify
FAQ
What Is an Inventory Aging Report?
It’s a breakdown of how long each SKU has sat in stock, grouped into time buckets like 0 to 30 or 90-plus days, showing exactly how much value is tied up in slow-moving inventory.
How Do You Calculate Inventory Aging?
Subtract the receipt date (or last-movement date) from today’s date to get days in inventory, then assign that number to a bucket using a formula like Excel’s IFS function.
What Does an Inventory Aging Report Look Like?
It’s typically a table listing SKU, quantity, unit cost, total value, and days in inventory, summarized into a pivot showing total value per aging bucket, often split by warehouse or lot.
How Do You Create an Inventory Aging Report?
Export your inventory data with dates and costs, calculate days in inventory with a date formula, assign buckets, and pivot the results by bucket for quantity and value totals; a live inventory system like Envio Logistics, Inc’s portal can automate this instead of rebuilding it manually each week.
How Often Should an Aging Report Be Run?
Perishables need daily near-expiry checks, operations teams should review the full report weekly, and finance typically pulls it monthly for close and obsolescence reserve calculations.
0 comments