
Sell-through rate measures the percentage of inventory you sell within a set period, calculated as units sold divided by units received (or available). A healthy rate generally falls within a range that varies depending on category, and anything below 40% for a sustained stretch signals overstock or weak demand. Track it at the SKU level, monthly at minimum, and act on the outliers first.
TL;DR:
- Sell-through rate below 40 percent for sustained periods indicates overstock or weak demand, especially if not adjusted for category-specific benchmarks.
- Using both receipt-based and available-stock formulas provides insight into purchase performance and inventory carryover, helping identify slow-moving SKUs.
- Quick actions like targeted discounts, bundling, and improving product placement can rapidly boost sell-through for slow SKUs.
- Pairing sell-through rate with turnover and GMROI helps determine whether to reorder, markdown, or transfer inventory between channels.
- Real-time inventory visibility from a third-party logistics provider enables faster response to low-performing SKUs and prevents cash tie-up.
Table of Contents
- What Is Sell-Through Rate and Which Formula Should You Use?
- How Do You Calculate Sell-Through Rate Step by Step?
- What Counts as a Good Sell-Through Rate?
- How Do You Read Sell-Through Alongside Turnover and GMROI?
- What Are the Best Tactics to Increase Sell-Through Rate?
- How Does a 3PL Turn Sell-Through Data Into Action?
- My 30-Day Checklist for Improving Sell-Through
- Want Sell-Through Data You Don’t Have to Chase Down Yourself?
- Sources
What Is Sell-Through Rate and Which Formula Should You Use?
Sell-through rate (STR) tells you how much of your inventory actually moves versus how much sits on a shelf or in a warehouse bin. It’s the single fastest gut check for buying accuracy, and it’s also the metric that catches slow-moving SKUs before they turn into markdown headaches.
There are two formula variants worth knowing, and they answer different questions. The receipt-based formula is units sold ÷ units received during the period. This one is best for judging how well a specific purchase order or production run performed. The available-stock formula is units sold ÷ (beginning inventory + units received), and this version reveals carryover inventory that’s tying up cash right now, since it accounts for stock you already had on hand before the new receipts arrived, according to Calcipedia’s sell-through calculator.
Both numbers matter, and they often diverge. Watch for these common calculation errors:
- Counting pre-orders or backordered units in the denominator, which artificially deflates your rate
- Including in-transit stock that hasn’t physically hit your shelf or warehouse yet
- Failing to net out returns for categories with high return volume, like apparel or footwear
- Mixing SKUs with different receipt dates into one blended average, which hides which items are actually moving
How Do You Calculate Sell-Through Rate Step by Step?
Start with clean numbers. Pull units sold for the period, then pull units received (for receipt-based STR) or beginning inventory plus receipts (for available-stock STR). Divide, multiply by 100, and you have your percentage.
Here’s the math in practice. Say you received 500 units of a SKU in March and sold 310 of them by month’s end.
- Units sold: 310
- Units received: 500
- Receipt-based STR: 310 ÷ 500 = 0.62, or 62%
Now run the available-stock version. Suppose you started March with 120 units left over from February, plus the 500 new units, for 620 available. You sold the same 310 units.
- Available stock: 120 + 500 = 620
- Available-stock STR: 310 ÷ 620 = 0.50, or 50%
In a spreadsheet, the formula is simple: =UnitsSold/UnitsReceived for receipt-based, or =UnitsSold/(BeginningInventory+UnitsReceived) for available-stock. If receipts arrive in staggered batches throughout the month, use a weighted-average denominator or a running receipts-to-date total instead of a single month-end snapshot, since a flat denominator will understate STR early in the period and overstate it later.
What Counts as a Good Sell-Through Rate?
There’s no universal target, and chasing one is how sellers misread their own data. Sell-through benchmarks vary meaningfully by vertical, and a rate that’s alarming for one category is normal for another.

That said, some rough bands hold up across most retail contexts. Shopify’s guidance puts general retail goods in the 60% to 80% range as healthy. Consumables and beauty products often run higher, since replenishment cycles are shorter and shelf life pushes faster turnover. Luxury and high-ticket items typically run lower STRs by design, since a $3,000 handbag isn’t supposed to sell at the same clip as a $15 candle.
A few factors shift these targets:
- Price point. Higher price generally means slower, more deliberate purchase decisions, and a lower “acceptable” STR.
- Launch lifecycle. A new product in its first 30 days should be judged against launch-period benchmarks, not steady-state ones.
- Product type. Fashion drops move fast and get evaluated weekly. Core basics move slow and get evaluated monthly.
Skip the industry-average obsession. Compare your current STR to your own plan and to the same period last year. That comparison tells you more than any published band ever will.
How Do You Read Sell-Through Alongside Turnover and GMROI?
STR is a leading indicator, not a verdict. It tells you where to look, not what’s actually wrong, so pairing it with a few companion metrics keeps you from overreacting to one number.
Inventory turnover (cost of goods sold ÷ average inventory value) shows how many times you cycle through stock in a given period. GMROI (gross margin ÷ average inventory cost) tells you how much gross profit each dollar of inventory investment generates. Days inventory on hand converts turnover into a timeline, showing roughly how many days of stock you’re carrying at current sales pace. Used together with STR, these metrics round out the full financial picture that a single sell-through percentage can’t show on its own.
Here’s where it gets useful operationally. A SKU can show a strong 75% STR but weak GMROI if the margin got slashed to move it. Another SKU might show a mediocre 45% STR but strong turnover if it’s a low-cost item that replenishes fast. The signals don’t always agree, and that’s exactly when you need a decision framework:
- High STR + high GMROI → reorder, and consider increasing the next receipt quantity
- Low STR + low turnover → markdown or bundle before the inventory ages further
- Moderate STR + strong margin → hold steady, monitor weekly
- Low STR + tied-up cash + strong performance elsewhere → transfer stock to a better-performing channel or location
Pro Tip: Run this matrix at the SKU level, not the category level. A category can look “fine” on average while three specific SKUs quietly drain your cash.
What Are the Best Tactics to Increase Sell-Through Rate?
Once you’ve flagged a slow SKU, the fix depends on how much time you have and where the bottleneck sits. Prioritize by speed of impact.
- Run a targeted promotion or markdown. A 15% to 20% discount on a specific SKU, rather than a storewide sale, moves inventory without training your whole customer base to wait for deals.
- Bundle slow movers with fast sellers. Pairing a sluggish SKU with a proven bestseller often clears stock faster than a discount alone, and it protects margin better too.
- Adjust email and paid ad spend toward the SKU. If a product isn’t visible, it isn’t selling. Redirect a portion of your ad budget to spotlight the slow item for two to three weeks.
- Update merchandising placement. Move the SKU higher on the category page or into a more visible shelf position. Small visibility changes move measurable volume.
- Reallocate inventory across channels. If a SKU sells better on one marketplace than another, shift stock there instead of discounting it into oblivion everywhere.
- Improve the product page itself. Better photos, clearer sizing information, and stronger copy fix a slow SKU more often than sellers expect.
- Stagger future receipts and tighten reorder points. If a SKU’s STR trends low for two consecutive periods, cut the next purchase order size before you’re sitting on double the problem.
- Transfer excess stock between locations. Move it to a warehouse or store where demand is stronger rather than letting it age in place.
- Tighten returns handling. A slow returns process inflates apparent available stock and muddies your STR math; faster processing keeps the numbers honest.
Pro Tip: Fix the short-term symptom and the supply-side cause together. A markdown clears today’s backlog, but if you don’t also cut the next receipt quantity, you’ll be back in the same spot in 60 days.
How Does a 3PL Turn Sell-Through Data Into Action?
Running SKU-level sell-through analysis is only useful if you can act on it fast, and that’s where a lot of small sellers hit a wall. Spreadsheets get stale the moment a warehouse doesn’t update counts in real time.

A live inventory portal changes that math. When you can see units sold and units available by SKU on any given day, the receipt-based and available-stock calculations stop being a monthly chore and start being a daily glance. Pairing that visibility with SKU profitability reporting lets you connect a weak STR directly to margin impact, rather than guessing which slow SKU is actually costing you money.
A few operational levers matter here:
- Retail-prep compliance for marketplaces like Amazon and Walmart reduces listing rejections and the return volume that muddies your available-stock numbers
- Same-day fulfillment keeps your sold-units data current, so STR reflects real demand instead of a shipping backlog
- Simpler cross-location transfers mean a slow SKU in one warehouse can reach faster-moving demand elsewhere without a multi-week delay
My 30-Day Checklist for Improving Sell-Through
I’d start week one by pulling SKU-level STR for every active product, both receipt-based and available-stock versions, and flagging anything under 40%. Week two, shortlist your three worst performers for markdown or bundling, and cut the next reorder quantity on each. Week three, fix one merchandising or product-page issue per flagged SKU. Week four, re-run the numbers.
By day 30, you won’t have solved everything, but you’ll know exactly which SKUs are worth scaling and which ones are quietly costing you cash.
— Reddog
Want Sell-Through Data You Don’t Have to Chase Down Yourself?
Envio3pl gives small and mid-sized sellers the SKU profitability reporting and live inventory visibility that make sell-through analysis a daily habit instead of a monthly scramble. No long-term contracts, same-day shipping on orders placed by 1PM CST, and full clarity on which SKUs are earning their shelf space.
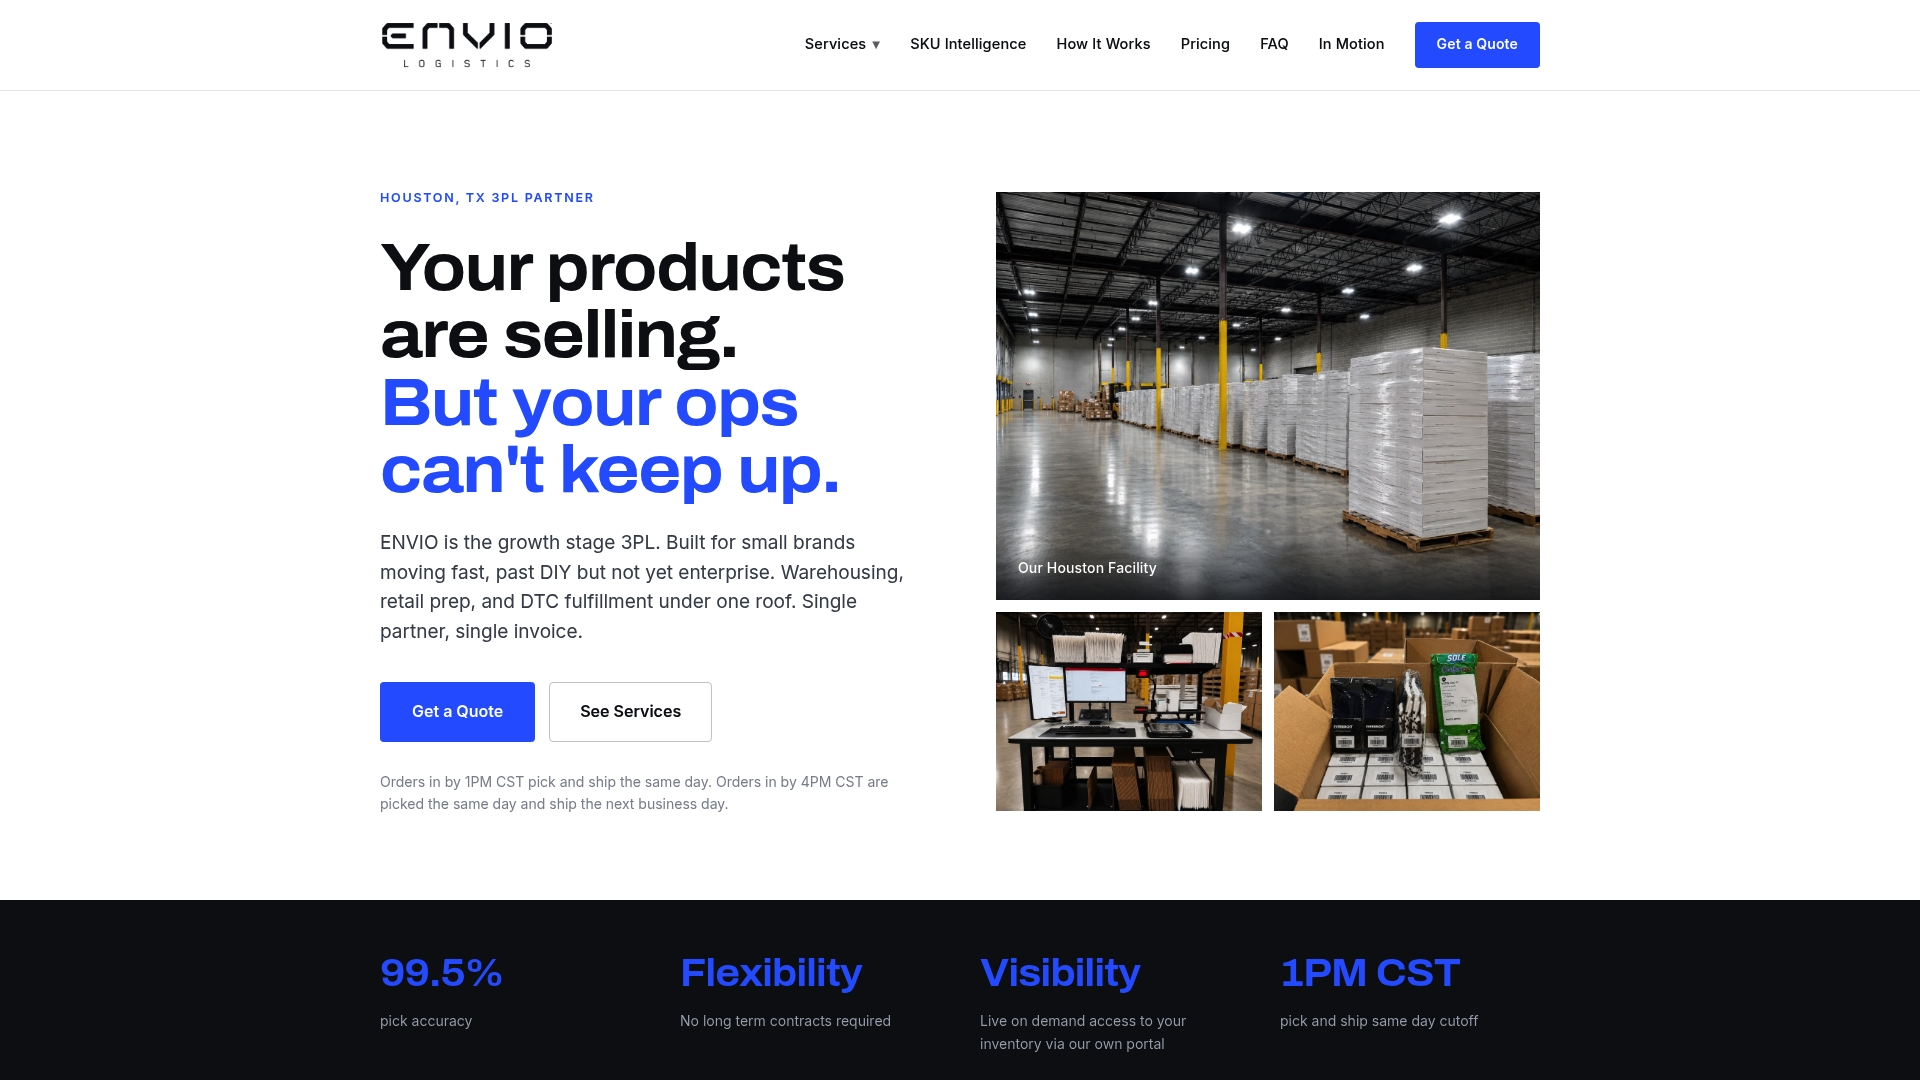
That kind of visibility matters most when a slow SKU is bleeding cash somewhere between your warehouse and your storefront, and you need to know fast, not next quarter. Envio3pl combines warehousing, retail prep for marketplaces like Amazon and Walmart, and direct-to-consumer fulfillment in one place, so you’re not stitching together data from three different vendors to answer one question. If you’re ready to see what SKU-level clarity looks like for your own catalog, check out Envio’s warehousing and fulfillment services and request a quote.
Sources
- Average sell-through rate by vertical | Eightx
- What is Sell-Through Rate and Why is it Important? | Lightspeed
- Sell-Through Rate Calculator | Calcipedia
- Sell-through rate: how to calculate & improve it | Shopify
0 comments